Monitoring, Logging & Observability
See Everything. Respond Faster. Invotyx builds full stack observability into your systemsgiving you visibility, insights, and control to detect issues before they impact users.
See Everything. Respond Faster. Invotyx builds full stack observability into your systemsgiving you visibility, insights, and control to detect issues before they impact users.
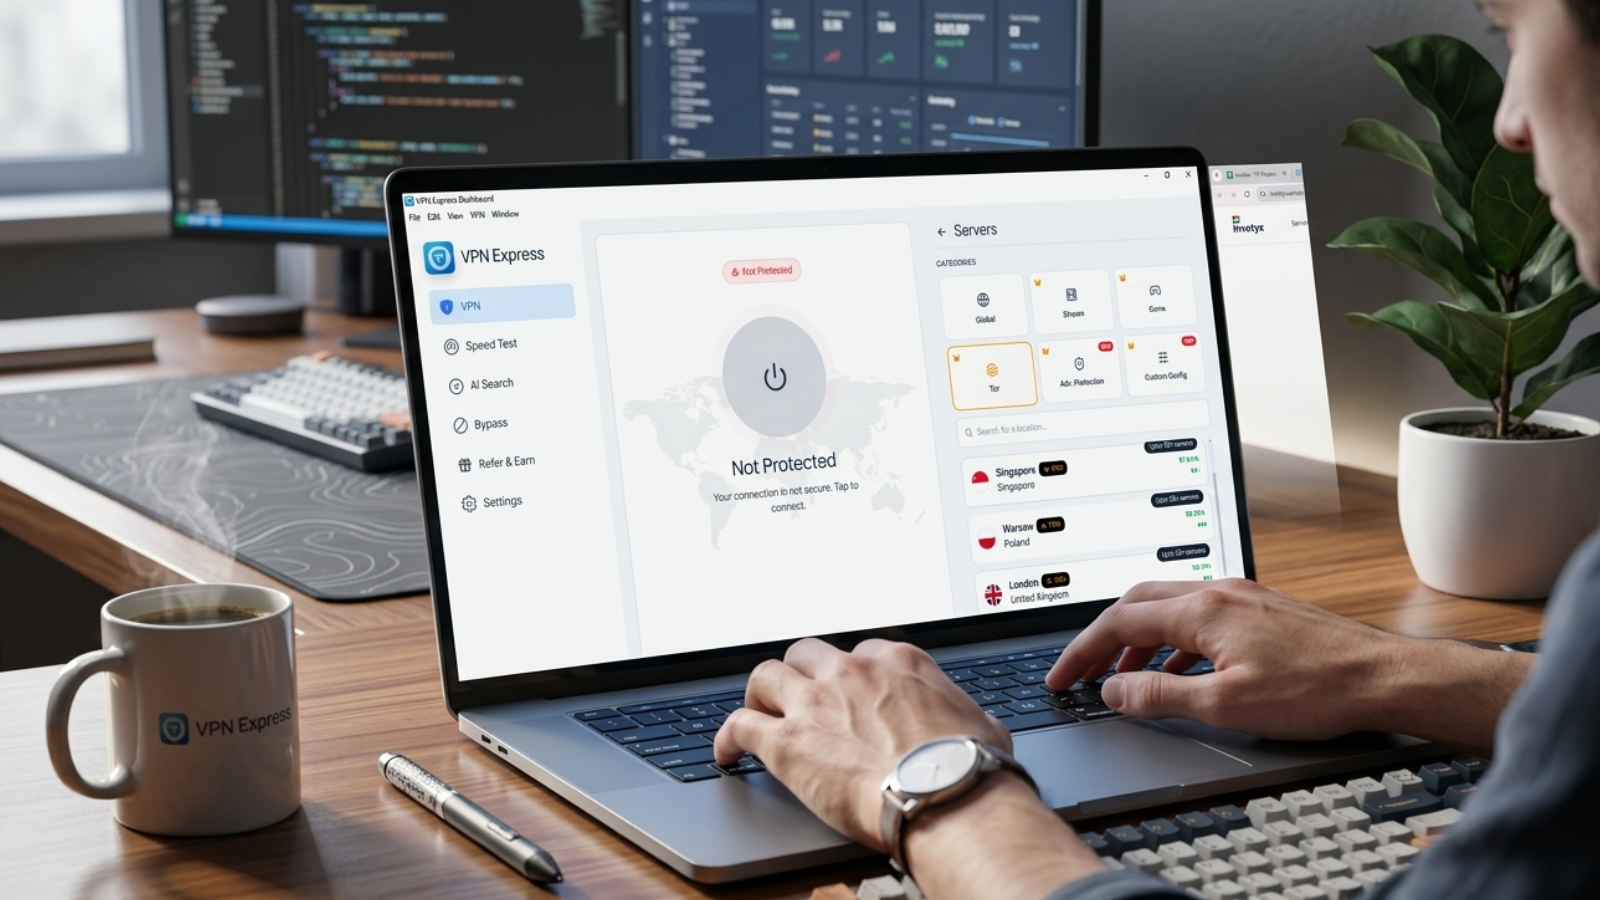
How We Engineered a VPN That Thinks, Adapts, and Protects — Without Users Touching a Single Setting
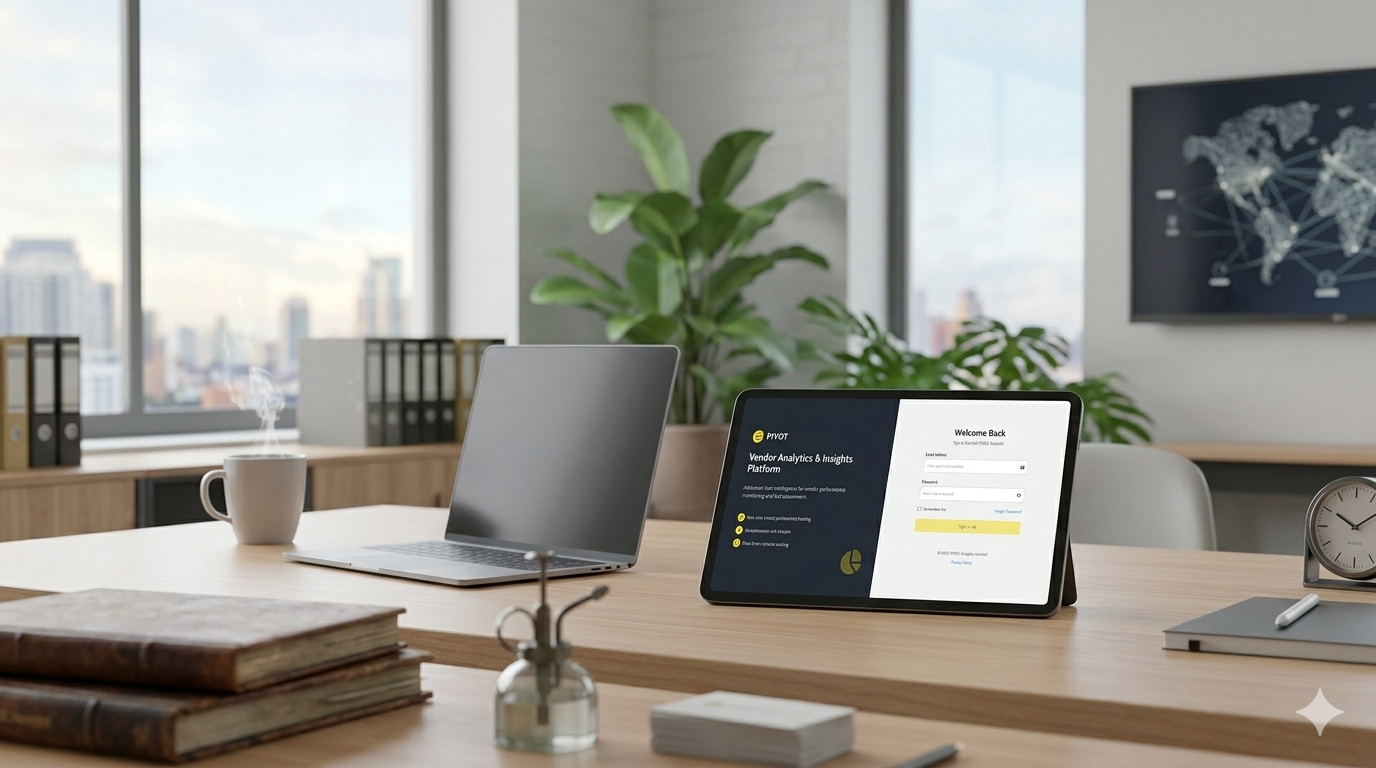
Built to help energy-sector enterprises evaluate vendor performance through real-time AI insights.
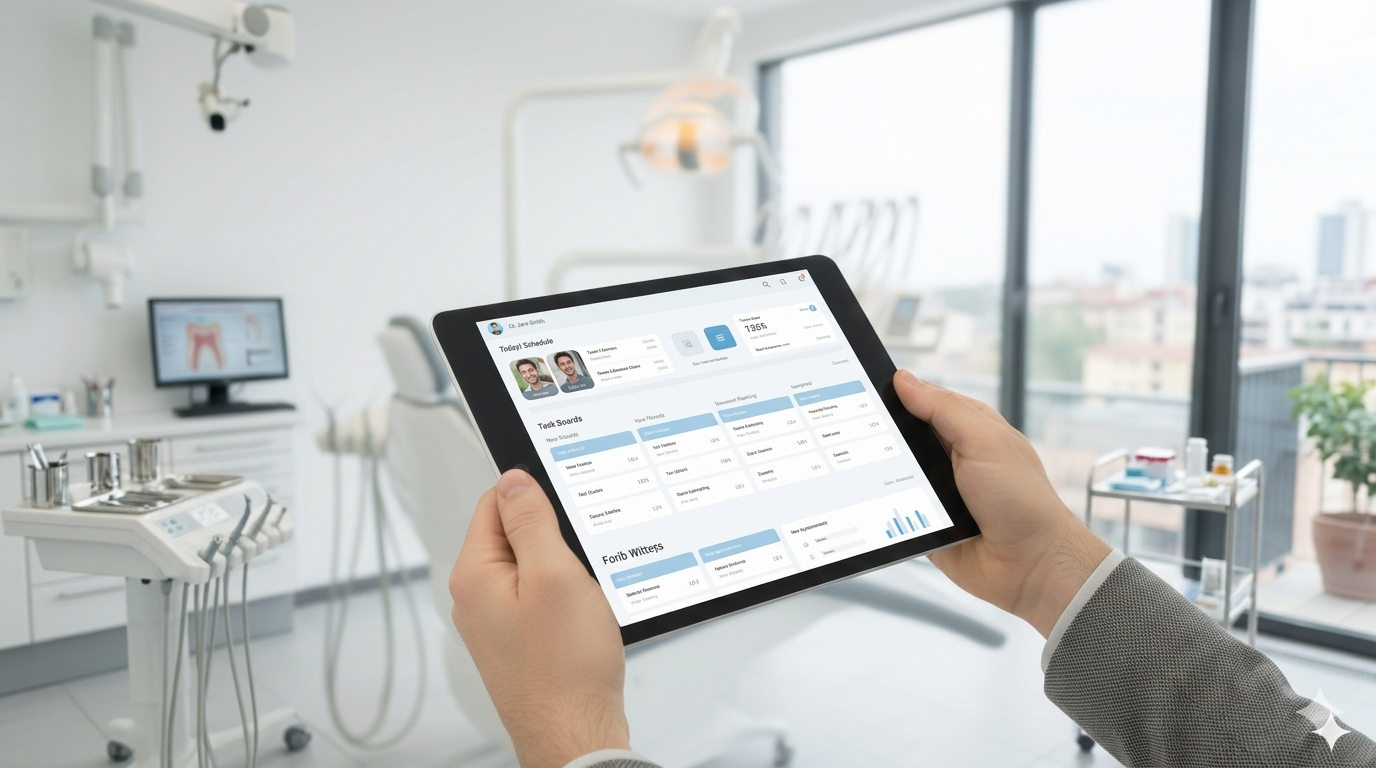
Built to help Dentists streamline their consultations with 100% focus with AI-powered dentistry Dashboard
Identify anomalies and failures before they escalate.
Get to root causes faster with comprehensive logs and traces.
Gain insights into application performance and resource usage.
Set up intelligent alerts that notify teams at the right time.
Use metrics and trends to inform capacity planning and optimization.
Track access patterns and audit logs for compliance requirements.
OUR IMPACT
We turn early-stage concepts into credible delivery momentum, giving teams a practical path from validation to stakeholder buy-in and production readiness.
OUR PROCESS
A systematic approach to monitoring, logging, and full stack visibility
We evaluate existing monitoring tools and identify blind spots in system visibility.
We establish monitoring standards, metrics, logging formats, and observability goals.
We choose and deploy tools like Prometheus, Grafana, ELK, Datadog, or Splunk based on your needs.
We add monitoring agents, log collectors, and tracing libraries to capture telemetry data.
We centralize logs from all sources for searchability and long term retention.
We create intuitive dashboards showing system health, performance, and key metrics.
We set up intelligent alerts with appropriate thresholds and notification channels.
We implement tracing to follow requests across microservices and identify bottlenecks.
We enable your teams to query logs, interpret metrics, and respond to alerts effectively.
We continuously refine monitoring coverage and add new telemetry as systems evolve.
A dedicated team to design, implement, and operate monitoring and observability platforms.
Centralized monitoring and observability platform with self-service dashboards and alerting.
Fixed-scope monitoring implementations with measurable improvements in visibility and uptime.
Cloud platforms and tools that power enterprise-grade infrastructure
We'd love to hear from you. Let's connect and explore how we can help.